Construction production indices (previous year=100%) (Y)
New construction commissioning (Y)
Construction production index (the corresponding period of the previous year=100%) (M)
Commissioning of residential new buildings (Q)
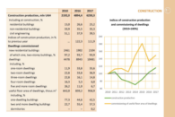
Construction production indices (previous year=100%)
Lvivska oblast
2011
2012
2013
2014
2015
2016
2017
2018
2019
2020
2021
Construction - all
105.3
81.5
93.4
89.6
120.1
122.3
111.9
111.5
123.3
122.7
110.4
Buildings
104.4
83.8
105.5
95.2
121.7
125.9
108.5
103.4
133.3
88.7
126.0
residential buildings
112.1
88.5
113.6
115.1
124.7
119.5
106.9
101.8
125.1
86.7
148.9
non-residential buildings
101.0
81.5
101.1
83.0
119.2
131.6
109.9
104.6
139.5
90.0
111.8
Civil engineering
106.2
79.2
81.3
82.3
117.7
116.7
117.5
124.1
110.5
174.4
98.4
Notes:
Construction production indices, introduced in 2013 and is calculated in compliance with international construction standards according to the Methodology approved by the order of the State Statistics Committee of Ukraine No.91. dated March 14, 2013. The indices for years 2011-2012 were recalculated based on the new methodology.
The list of settlements of administrative-territorial division (variable Territory) is presented in transliteration.
The English version of some transliterated Ukrainian words is presented below: Region = rehion / oblast
Notes:
Since the first quarter of 2024 data include the commissioned dachas and garden buildings. Since 2018 the total area of commissioned residential buildings is determined by residential buildings of new construction. Data for 2003-2017 have been calculated retrospectively. Symbol (с) – data are not released in order to comply with the requirements of Ukraine`s law on official statistics regarding the provision of guarantees of the state statistics bodies on statistical confidentiality.The list of settlements of administrative-territorial division (variable Territory) is presented in transliteration. The English version of some transliterated Ukrainian words is presented below: Region = rehion / oblast
Construction production index (the corresponding period of the previous year=100%)
Lvivska oblast
January
January-February
January-March
January-April
January-May
January-June
January-July
January-August
January-September
January-October
January-November
January-December
2020
113.4
120.2
116.0
105.6
104.6
99.7
105.5
112.1
111.4
115.7
118.7
122.7
2021
78.9
91.2
98.2
107.4
110.8
115.2
112.5
110.3
111.2
111.9
112.2
110.4
2022
155.5
..
..
..
..
..
..
..
..
..
..
..
Notes:
From 2013 the construction production index is calculated in compliance with international construction standards according to the Methodology approved by the order of the State Statistics Committee of Ukraine No.91. dated March 14, 2013; taking into account the refined data on volumes of construction production produced of enterprises according to the KVED-2010 (section «F»).
The list of settlements of administrative-territorial division (variable Territory) is presented in transliteration.
The English version of some transliterated Ukrainian words is presented below: Region = rehion / oblast
Total area, the corresponding period of the previous year=100%
134.2
111.4
112.5
106.8
2024
Apartments, units
2209
4833
9286
12627
Total area, sq.m
212156
437507
783385
1062432
Total area, the corresponding period of the previous year=100%
119.5
123.3
137.9
131.9
2025
Apartments, units
3076
5646
9137
12594
Total area, sq.m
260614
476562
759753
1066909
Total area, the corresponding period of the previous year=100%
122.8
108.9
97.0
100.4
Notes:
Since the first quarter of 2024 data include the commissioned dachas and garden buildings. Since I quarter 2018 the total area of commissioned residential buildings is determined by residential buildings of new construction. Data for 2016 and 2017 have been calculated retrospectively. Symbol (с) – data are not released in order to comply with the requirements of Ukraine`s law on official statistics regarding the provision of guarantees of the state statistics bodies on statistical confidentiality.
The list of settlements of administrative-territorial division (variable Territory) is presented in transliteration.
The English version of some transliterated Ukrainian words is presented below: Region = rehion / oblast
CONSTRUCTION WORK PERFORMED (OUTPUT OF CONSTRUCTION WORK)
- includes the cost (in current prices, VAT and payments to subcontractors excluded) of the specified work performed in the course of new construction, renovation, refurbishment of buildings and engineering structures, restoration and technical re-equipment of enterprises.
CONSTRUCTION WORKS
- include general and specialized work on construction of buildings and structures (Classification of Types of Economic Activity (SC 009:2010)).
VOLUME INDEX OF CONSTRUCTION WORK PERFORMED
- is defined as the ratio of the value of work performed during the reference period starting with the beginning of the year to the value of work performed of corresponding period a year earlier, deflated by a price index of construction and installation
CONSTRUCTION PRODUCTION INDICES
- is calculated using International standard in Construction and according methodic of SSSU decree N91 of March 14, 2013.
The data for 2011-2019 have been recalculated on base 2010=100%. Since January 2020 the base year for index has been changed to 2016.
Since January 2020, indices have been calculated taking the average for 2016 = 100 as the base.
RESIDENTIAL BUILDINGS (DWELLING)
- include single-family houses, detached houses (detached houses), houses with two or more apartments, of both massive and individual development, as well as dormitories. Dormitories include: residential houses for joint dwelling, including houses for the elderly and persons with disabilities, students, children and other social groups, such as refugee homes, workers 'and employees' dormitories, dormitories for students of higher education and other establishments, infant homes and orphanages, shelters for the homeless and so on.
NON-RESIDENTIAL BUILDINGS
- include hotels, restaurants, office buildings, buildings in wholesale and retail trade, transport and communication buildings, industrial and warehouses, for public entertainment; educational, health-related, recreation buildings, etc. (DK 018: 2000)
TOTAL AREA OF DWELLING (FLAT SIZE)
- sum of spaces of the residential and subsidiary premises excepting loggias, balconies, porches and terraces, cold storerooms, lobbies.
TOTAL AREA OF RESIDENTIAL BUILDINGS
- is defined as the sum of the total area of residential buildings of new construction
Until 2017 inclusive (unless otherwise noted) is defined as the sum of the total housing area of new residential buildings and the increase in the total area resulting from refurbishment of the existing housing stock and other buildings.
TOTAL AREA OF THE COMMISSIONED HOUSING
- includes the total area of the housing commissioned in accordance with the procedures (Order of the Ministry of Regional Development of Ukraine No. 95 dated 19.03.2013 and No. 24 dated 24.06.2011) and the Temporary Procedure (Decree of the CMU No. 1035 dated 09.09.2009).


 Construction production indices (previous year=100%) (Y)
 Percentage increase (decrease) in construction production volumes (previous year = 100%) (Y)
 EMAIL: ve@lv.ukrstat.gov.ua
